
We merge Open Data from different authorities in Switzerland and publish them as merged datasets in an API, for easier downstream usage by Data Analysts.
| Target | URL |
|---|---|
| API Endpoint | https://odapi.bardos.dev |
| API Documentation | https://odapi.bardos.dev |
| Source Code | https://github.com/fbardos/odapi |
To see the data currently available in the API, use one of the dashboards for the published MARTs:
- Dashboard mart_traffic_bicycle on HEX
- Dashboard mart_traffic_miv on HEX
- Dashboard mart_ener_elec on HEX
- Dashboard mart_ogd_usage
- Merged datasets: from different authorities in Switzerland
- Fast API: API to retrieve data in multiple formats (csv, tsv, parquet, json, xslx)
- Historization: You can get a snapshot from the past, when data should not change over time
- With coordinates: Provides spatial data to easier show data on a map.
- Tested data: Use various data tests to increase the data quality
- Each model has its own data structure, besides the meta columns. A unique data structure (like in e.g. SDMX) for these heterogen data topics would not make sense, because it unecessarily increases the effort needed to understand retrieved data. Also, when the effort is a unique data structure, it forces retrospective data changes for older published models, which will then, again, break the downstream data usage.
To make downstream usage easier:
- Timestamps (DateTime) are shown in timezone UTC. UTC is spoken by most downstream tools and it removes daytime saving logic.
- Timestamps (DateTime) provided as ISO 8601. There are hundreds of time formats available worldwide. Use the established standard most tools will understand.
- Coordinates are in CRS WGS84/EPSG:4326. Most downstream data anlytics tools have only a basic functionality when it comes to visualizing spatial data. The first imlemented CRS is usually WGS84, because it is unique for the whole world.
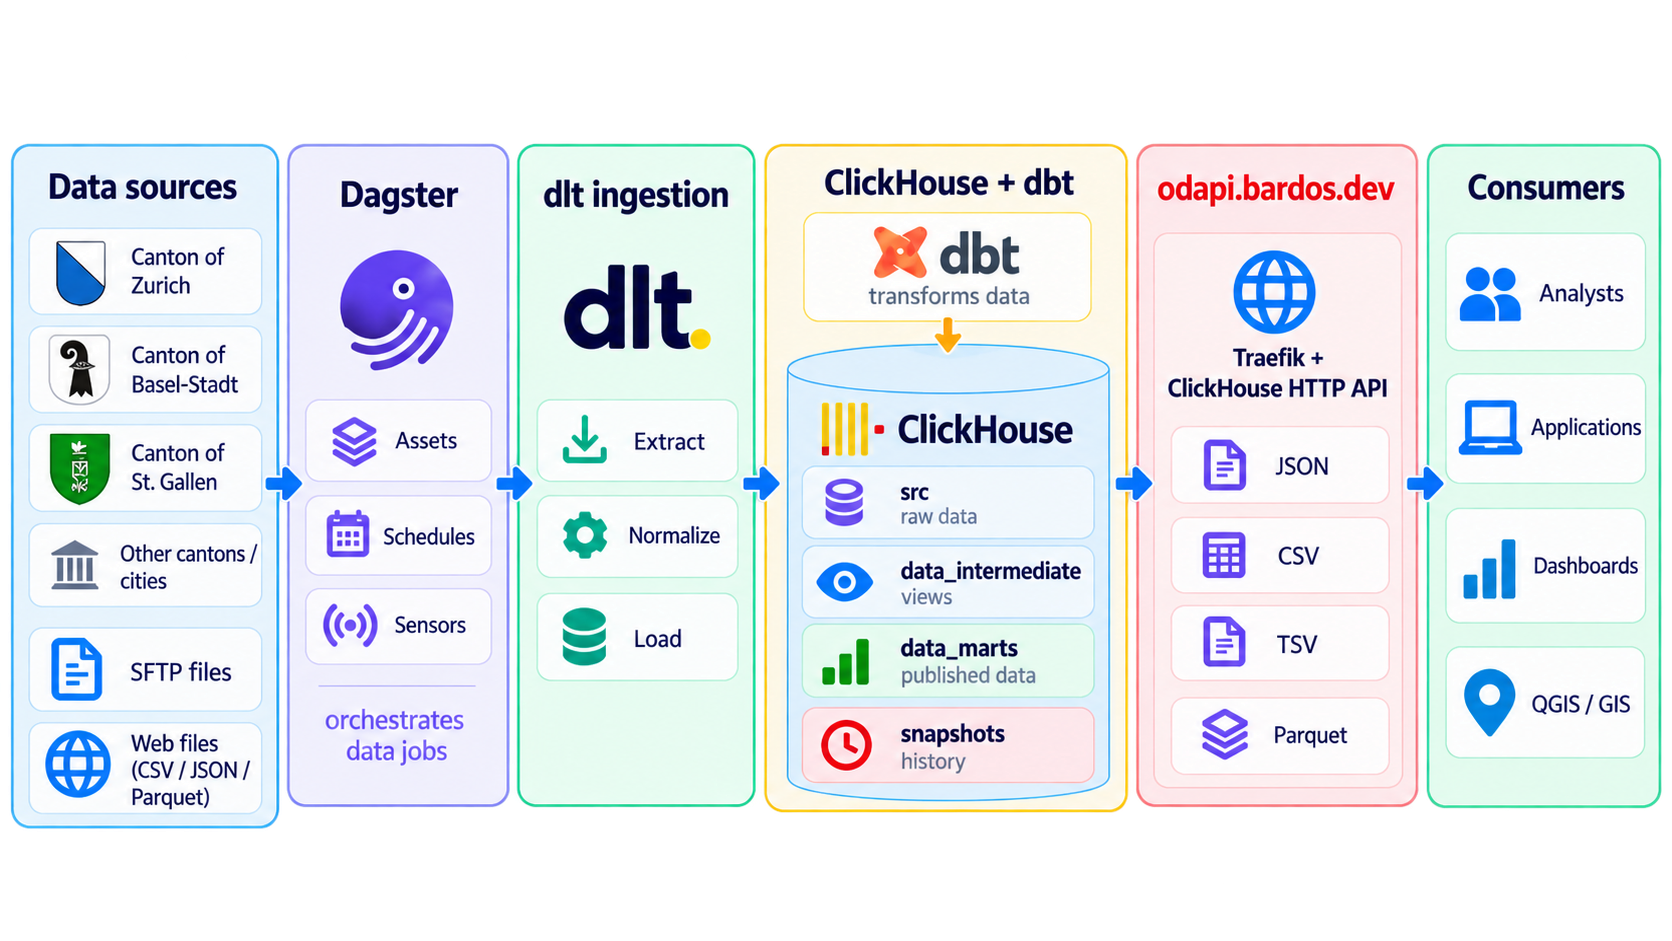
- Orchestrator: Dagster
- E, in ETL: DLT
- T, in ETL: DBT
- Database / API: Clickhouse