███████╗ ██████╗ ██████╗  ██████╗ ███████╗
██╔════╝██╔═══██╗██╔══██╗██╔════╝ ██╔════╝
█████╗  ██║   ██║██████╔╝██║  ███╗█████╗
██╔══╝  ██║   ██║██╔══██╗██║   ██║██╔══╝
██║     ╚██████╔╝██║  ██║╚██████╔╝███████╗
╚═╝      ╚═════╝ ╚═╝  ╚═╝ ╚═════╝ ╚══════╝
    >> gdbforge: Extreme Tooling Suite <<
gdbforge is a Vim-inspired multi-pane terminal front-end for GDB (and optionally Delve). It keeps the debugger's power in the TTY and adds a workspace for source, console, IO, threads, call stack, and breakpoints — with modes, a : command line, mouse/clipboard, and Lua automation.
- Debugging Linux applications — internal
:b ioor external terminal (embedded guide) - Embedded Linux boards —
:lua remotegdb(scp + gdbserver) (embedded guide) - Zynq MPSoC Cortex-A53/R5 — J-Link / OpenOCD (MPSoC guide)
- STM32 bare-metal — Nucleo F429ZI, STM32F405 (ST-Link OpenOCD / J-Link; STM32 guide)
- Linux kernel kgdb — UART, Ethernet, modules (kernel guide)
- Go programs via Delve (
-g dlv), including TUI targets in an external terminal - Teams who want a Vim-like flow: normal / insert / command modes, panes, buffers
Screencasts (YouTube). Order: embedded MCU → everyday Linux → dogfooding → Linux kernel (kgdb_uart).
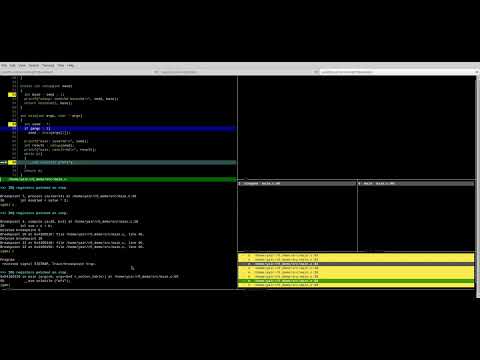
Cortex-R5 / J-Link — multi-pane UI stepping a deep call stack, with :lua r5_baremetal_jlink bring-up (gdbforge.spawn → JLinkGDBServer → attach). Sample: examples/stack_demo.c. Guide: docs/MPSOC_DEBUG.md. Watch on YouTube.
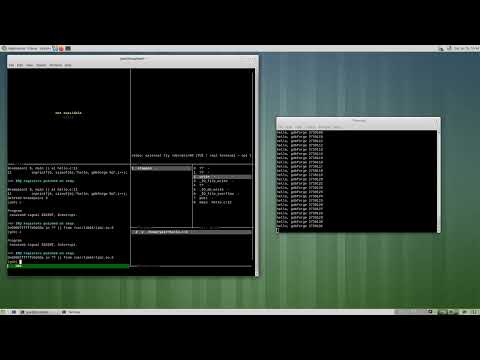
Linux app — external terminal print vs the internal IO pane (:b io). Watch on YouTube.
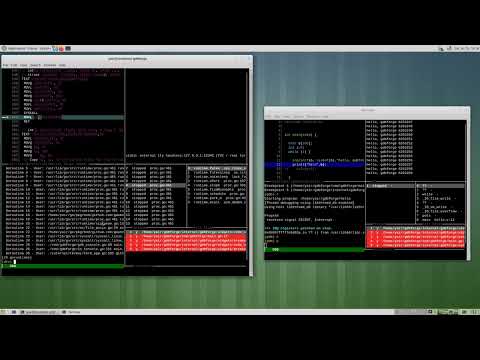
Debug itself — gdbforge attached to a live gdbforge session (Go / Delve), stepping its own code. Watch on YouTube.
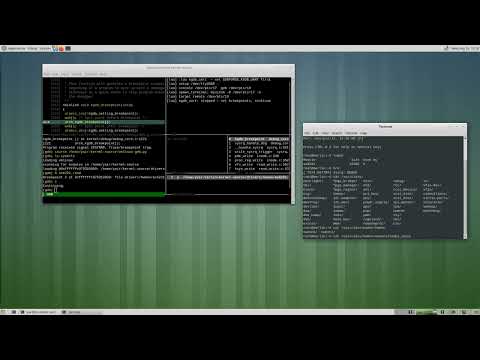
Linux kernel (:lua kgdb_uart) — one shared UART + kdmx: :lua kgdb_uart configures kgdboc, starts kdmx, opens minicom on the console PTY, and breaks into kgdb in about two seconds (target remote on the gdb PTY). Then lx-symbols, a breakpoint on a driver's read path, continue, and cat /dev/… from minicom to hit it — step in :b gdb, continue back to the shell. Watch on YouTube.
STM32 Nucleo F429ZI (:lua nucleo_f429zi) — bare-metal Zephyr app debug, then Zephyr-aware debug with info threads and on-board displays. Guide: docs/STM32_DEBUG.md. Watch on YouTube.
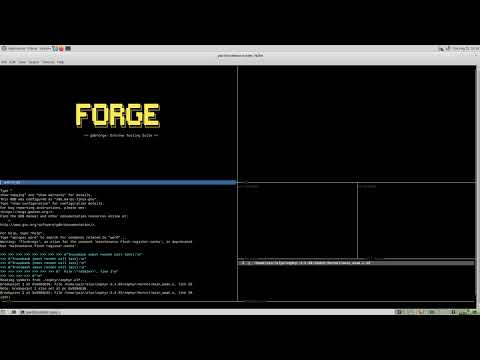
Kernel demo — setup stages (`kgdb_uart`)
Stage 1 — env + one-shot script (host)
export GDBFORGE_KGDB_UART=/dev/ttyUSB0
export GDBFORGE_KGDB_VMLINUX=/path/to/vmlinux
export GDBFORGE_KGDB_MODULES=/path/to/kernel-source   # for lx-symbols
./bin/gdbforge -g gdb
# then:
:lua kgdb_uart
The script claims the UART, sets kgdboc, starts kdmx (console PTY + gdb PTY), spawns minicom, loads vmlinux, sysrq-breaks in, and runs target remote — stopped in kgdb in ~2 s.
Stage 2 — module symbols + breakpoint
In :b gdb (after the script returns):
(gdb) lx-symbols /path/to/kernel-source
(gdb) break my_driver_read
(gdb) continue
Stage 3 — trigger from minicom (what the screencast shows)
In the minicom window on the console PTY:
cat /dev/my_device
GDB stops on the driver's read path; debug with n / s / c in gdbforge, then (gdb) continue returns to the shell.
Also available: :lua kgdb_net (Ethernet), :lua kgdb_serial (in-process mux, one UART). Two independent UARTs need no mux — see docs/KERNEL_KGDB.md. Catalog: lua/README.md.
One UART vs two — :serial-switch semi mux
When only one USB serial cable is available, gdbforge can hold /dev/ttyUSB0 and expose two PTYs (console + gdb) via an in-process mux (:lua kgdb_serial, :serial-switch gdb|console, :lua kgdb_trigger). That workflow is semi-automatic: you must switch who owns the wire before kgdb stop packets arrive, and breakpoints triggered from the console while the mux is on the console leg will not reach GDB (see known limitation in the doc below).
| Two UARTs (manual) | One UART + kdmx (kgdb_uart, this demo) |
One UART (kgdb_serial mux) |
|
|---|---|---|---|
| Console while running | Always on PS0 | minicom on console PTY (kdmx) | minicom on console PTY when mux owner = console |
| GDB while stopped | Always on PS1 | target remote on gdb PTY (kdmx) |
target remote on gdb PTY when owner = gdb |
cat / driver trigger → BP |
Works | Works (kdmx demux) | Fails unless gdb leg owns UART before trigger |
| Automation | Manual setup | :lua kgdb_uart (~2 s break-in) |
Sysrq-oriented; manual order matters |
Full write-up: docs/KERNEL_KGDB.md (Path 1 kdmx, Path 1b in-process mux, Ethernet, recovery, env vars).
mkdir -p .gdbforge/lua
cp -r lua/mpsoc/cortex_r5 .gdbforge/lua/
# then inside gdbforge:  :lua r5_baremetal_jlink
More installable workflows: lua/README.md — platform sections (mpsoc/, stm32/, kernel/, embedded/), env vars, and :lua recipes.
The terminal UI — modes, : command line, split-tree panes, tabs, layouts, and the
terminal emulator pane — is a separate project:
termforge. gdbforge is the first and largest
application built on it, and everything in this repository is debugger-specific.
If you want to build a different keyboard-driven terminal app (a trading dashboard, an ops console, a log explorer), start from termforge rather than from this repo:
go get github.com/yairgd/termforge
go run github.com/yairgd/termforge/cmd/demo@latest # runnable example| Layer | Where |
|---|---|
| Framework | github.com/yairgd/termforge — widgets, window manager, commands, PTY plumbing |
| Example app | cmd/demo in that repo |
| Debugger app | this repo: cmd/gdbforge + internal/gdb / dlv / mcp / gdbforge/* |
Import rules for this repo: docs/DEPENDENCIES.md
(task check-imports).
- Switching constantly between a raw GDB TTY and a separate editor/viewer
- Weak or fixed pane layouts for source, console, and process state
- Limited mouse and clipboard in classic terminal debugger UIs
- Hard-to-discover keys and no in-app manual
- Accidental resume of a running inferior when changing frames/threads
- Named layouts (
:layout wide,panels,default,classic) and splits (:vs/:split) - Code (or startup logo), GDB/dlv console, IO, Threads, Call Stack, Breakpoints
- In-app manual:
:helpor:b help(full text: docs/USER_GUIDE.md) - Space to toggle breakpoints; YAML persist under
./.gdbforge/breakpoints.yaml - Themability, clipboard/mouse selection, Vim-style modes and focus chords
- Safer while-running BP insert (no surprise continue on frame/thread switches)
- External terminal for TUI inferiors (
:set inferior-tty/:lua dlv_ext_port) - Lua automation (
gdbforge.*) — API: docs/LUA_API.md - Optional Delve backend:
gdbforge -g dlv ./hello-gothen:lua dlv_ext_port 1234
Requirements: Linux (or similar) terminal, Go, gdb + gcc on PATH.
git clone https://github.com/yairgd/gdbforge.git
cd gdbforge
go build -o bin/gdbforge ./cmd/gdbforge
Hello world:
cat > hello.c <<'HEOF'
#include <stdio.h>
int main(void) { printf("hello, gdbforge\n"); return 0; }
HEOF
gcc -O0 -g -o hello hello.c
./bin/gdbforge ./hello
Inside the app: open :help, step with n / s / c, quit with Ctrl-D or :quit.
# Delve (Go)
./bin/gdbforge -g dlv ./hello-go

# Pass GDB options after --
./bin/gdbforge -- -nx -x ./board.gdb ./zephyr.elf
More demos: gcc -O0 -g -o stack_demo examples/stack_demo.c && ./bin/gdbforge ./stack_demo.
Full documentation (architecture, debugger integration, input/completion): gdbforge docs — local preview: ./docs/serve.sh → http://127.0.0.1:8765/gdbforge/.
Code flows — searchable call trees (Tab completion, Ctrl-C, stop pipeline, :gdb continue, …) with GitHub file:line links: Flow browser. Analysis uses the official x/tools/cmd/callgraph (go tool callgraph -algo vta); curated triggers live in docs/flows/flows.spec.yaml and CI regenerates the catalog with go run ./cmd/flowdoc --generate. See also DEBUGGER_INTEGRATION.md and DEVELOPER_GUIDE.md.
| Doc | Contents |
|---|---|
| docs/USER_GUIDE.md | Full user manual (same material as :help) |
| docs/LUA_API.md | gdbforge.* Lua reference for script authors |
| lua/README.md | Installable Lua workflow catalog (mpsoc / stm32 / kernel / embedded) |
Published on gdbforge docs with search-friendly meta tags:
| Guide | :lua examples |
Topic |
|---|---|---|
| EMBEDDED_LINUX_DEBUG.md | remotegdb, terminal_debug, external_tty, gdbserver_tui |
Board apps, :b io vs external terminal |
| MPSOC_DEBUG.md | r5_baremetal_jlink, a53_baremetal_jlink, OpenOCD variants |
Zynq UltraScale+ MPSoC A53/R5 |
| STM32_DEBUG.md | nucleo_f429zi, stm32f405_stlink, stm32f405_jlink |
STM32 board catalog #1–#2 (extensible); ST-Link / J-Link / Zephyr |
| KERNEL_KGDB.md | kgdb_kdmx, kgdb_net, kgdb_serial |
Linux kernel & module debug |
| Doc | Contents |
|---|---|
| docs/PTY_ARCHITECTURE.md | Dual PTY master/slave, GDB vs Delve, :b io, external terminal |
| docs/DEPENDENCIES.md | The termforge boundary; internal import rules |
| docs/ | Architecture, debugger integration, developer guides |
View docs locally: ./docs/serve.sh → http://127.0.0.1:8765/. Deployed site: https://yairgd.github.io/gdbforge/.
MIT License